Find Cable TV & Internet Providers In Your Area
Enter your zip to see providers in your area.


Let's hook you up with the best TV and internet
Here at CableTV.com, we make the search for TV and internet in your area easy so you can fast-forward to the fun part—having TV and internet.
![]()
Tv Service
Your favorite shows and movies are chilling out on cable TV, satellite TV, and online streaming services. We’ll break down all these TV options so you can find your favorite way to tune in.
See TV Providers![]()
Internet Service
You deserve internet with fast download speeds and tons of data—at a great price. We research and review every major internet provider in the US so your home Wi-Fi will rock.
See Internet Providers![]()
Compare Providers
At first glance, all your cable TV and internet options may seem overwhelming. But once you see which providers are in your area, it’s easy to compare them head-to-head.
Compare Providers
Helpful Resources
We’re here to help you binge-watch TV and surf the internet better. That’s why we’ve got the hook up on the best universal remotes, streaming devices, mesh Wi-Fi, and more.
Browse ArticlesFind top internet and TV providers
We’ve got the deets on every major TV and internet provider in the US. Read some of our expert reviews to see
which one is right for you.
TV Providers
Streaming Providers


Internet Providers


Get quick answers without the stress
Certain questions are easy to answer if you’ve got the right tool for the job. Spare yourself the elbow grease—our toolbox is ready for you, neighbor.
What show should you watch next?
No need to channel surf—you can find the perfect show for your tastes with the help of our TV show algorithm. It’s like a mystical TV mind reader.
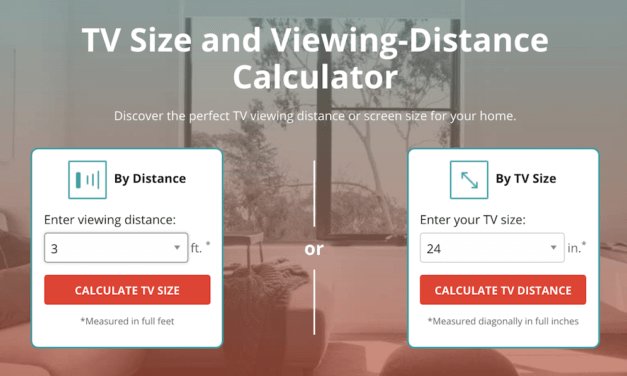
How far should your couch be from your TV?
Listen, this might sound silly, but how you position your TV totally affects its visibility—and your comfort. Now you don’t have to go blind like your mother warned, all thanks to our TV distance calculator.
We research so you don't have to
No one here expects you to know everything about TV and internet—that’s our job. So let our team of experts guide you to the best services and products out there.
Check Out Our Head-to-head Comparisons
Sling TV offers a good deal for an affordable price—its packages have some flexibility, and its largest package is still cheaper than YouTube TV. But YouTube TV offers more channels and unlimited cloud DVR storage space, so in many ways, you really do get what you pay for.
When the competition is AT&T Fiber vs. Xfinity Internet, we say AT&T is better than Xfinity. While our recent customer satisfaction survey put AT&T Fiber and Xfinity Internet on equal footing for reliability, you’ll get faster speeds if you go with AT&T Fiber.
DISH and DIRECTV square off in this match-up of satellite TV titans. Get the pros and cons of TV service from DISH vs DIRECTV in an unbiased comparison from CableTV.com. Spoiler alert: we give the edge to DISH.
Our Editor's Choice Awards Connect You to the Best of the Best

CableTV.com wants you to live your best life on the couch. And if you’re gonna do that, you need to know which TV provider is the best for your lifestyle and needs. Which is the best value, or the cheapest? And which is the best overall?
If you already have Netflix or want to add another quality video streaming service, we also love Disney+ for families and HBO Max for original content. But we don’t stop there. Keep reading to find the best on-demand streaming service for you.

Whether you’re looking for the absolute best internet service or the fastest home internet, we’ve got you covered with five recommendations for the best internet providers.
Let's start watching!
Super fans, rejoice! Our TV guides help you watch the entertainment you’re passionate about, whether that’s pro football, live news, or streaming originals.
This year, the NBA Playoffs are on ABC, ESPN, TNT, and NBA TV. Our viewing guide maps out the NBA postseason schedule and the best ways to tune in so you don’t miss a single dribble.
America’s pastime is back, and our sports experts researched and tested the best TV services for watching Major League Baseball games this season.

Catch your favorite show, film, or musician with our list of upcoming awards shows. If something’s listed as TBD, don’t sweat it—we’ll update as soon as we get more information about that event.
Experience the thrills and chills of every major sports event in 2024 with our regularly-updated TV sports schedule.

Life comes at you fast—news comes even faster. Luckily, there are a ton of live TV news channels, like ABC, CBS, FOX News, NBC, and more, available for you to watch and stream for free.

It’s time for the Spring 2024 anime season—find your next obsession with our guide to this season’s hottest new and returning titles.
